Rock Physics at Speed in RokDoc 2026.2
Pressure–depth plotting remains the foundation of pore-pressure interpretation, forming the basis for all subsequent modelling and geomechanical analysis. Interpretation begins with reliable visualisation of measured pressures, gradients, and operational limits. Robust interpretation also depends on the structured storage and controlled build-up of pressure datasets so that interpretation context is preserved and comparable through time. A dedicated interpretation environmentis therefore required in which pressure information can be managed consistently rather than reconstructed for individual studies. PressureView has been developed not only as a plotting environment but as a pressure-data framework that enables measurements, gradients, annotations, and interpretation context to be stored, revisited, and compared consistently across wells, projects, and regional studies, supporting continuity of interpretation and reducing variability associated with reconstructed or externally generated plots.
Within most pore-pressure workflows, visualisation forms both the starting point and the reference framework for subsequent modelling and analysis. Much of the plotting framework has been in continuous operational use for many years and remains central todaily pore-pressure workflows. For this release, development focused on the most widely used PressureView interpretation workflows in RokDoc, strengthening reliability, persistence, and usability while maintaining the familiar operational behaviour relied upon by experienced users. The objective was not to alter interpretation methods, but to improve the consistency and efficiency of the visualisation step on which those methods depend.
Plot scaling, axis limits, anddomain selections now persist correctly between sessions, ensuring that figures reopen exactly as configured and reducing unintended variation between interpretation steps. Long-standing inconsistencies in the resizing and positioning of plot elements have also been removed, improving repeatability when preparing figures for technical review and reporting.
Several targeted workflow enhancements have been introduced. Multi-axis horizontal scaling enables comparison of datasets expressed in different regional unit conventions withina single plot. Legend snapping improves layout consistency, while options for evenly distributing mudline gradients enhance clarity in well-planning displays. Additional colouring controls allow WFT measurements to be visualised by mobility or acquisition date, supporting rapid assessment of measurement context. Template functionality has also been extended so that fonts, gradient labels, and related display settings can be managed centrally, enabling consistent figure standards across projects and teams.
PressureView should be regarded as more than a cross-plotting utility. While pressure–depth plots may appear similar to figures generated in spreadsheet or scripting environments, PressureView provides a structured interpretation workspace in which depth domains, unit systems, annotations, gradients, and contextual datasets are managed interactively within a single framework. Interpreters can therefore move efficiently between alternative depth references, datasets, units, andvisual configurations while maintaining interpretation context, supporting rapid comparison and consistent interpretation rather than repeated reconstruction of individual plots. In contrast to general-purpose plotting environments, PressureView treats pressure visualisation as a primary interpretation step, providing a dedicated workspace for the comparison and interpretation of pressure relationships across wells and regions.
These developments areintentionally incremental, reflecting continued strengthening of the visualisation foundations on which reliable pressure interpretation depends. Improvements that enhance plot stability, persistence, and repeatability reduce variability in interpretation workflows and allow greater focus on interpretation itself. Maintaining PressureView as a persistent pressure database and interpretation workspace ensures reproducible plots and consistent interpretation context through time, an essential requirement as pore-pressure workflows become increasingly rapid and automated.
The following examples illustrate (1) the established PressureView plotting foundation, (2) recent workflow enhancements strengthening the stability and usability of core visualisation workflows, and (3) interpretation capabilities enabled by this strengthenedframework.
Figure 1. Standalone pressure–depth visualisation as originally implemented in the early PressureView system, illustrating the foundational multi-well plotting capability used to define the regional pressure framework through comparison of hydrostatic, lithostatic, and shale gradient trends. The PressureView plotting concept was later integrated into the RokDoc platform, where it has remained a core pore-pressure interpretation workflow for more than two decades (Post-Palaeocene data, UK North Sea Viking Graben; Ikon Science and S&P Global, 2008).
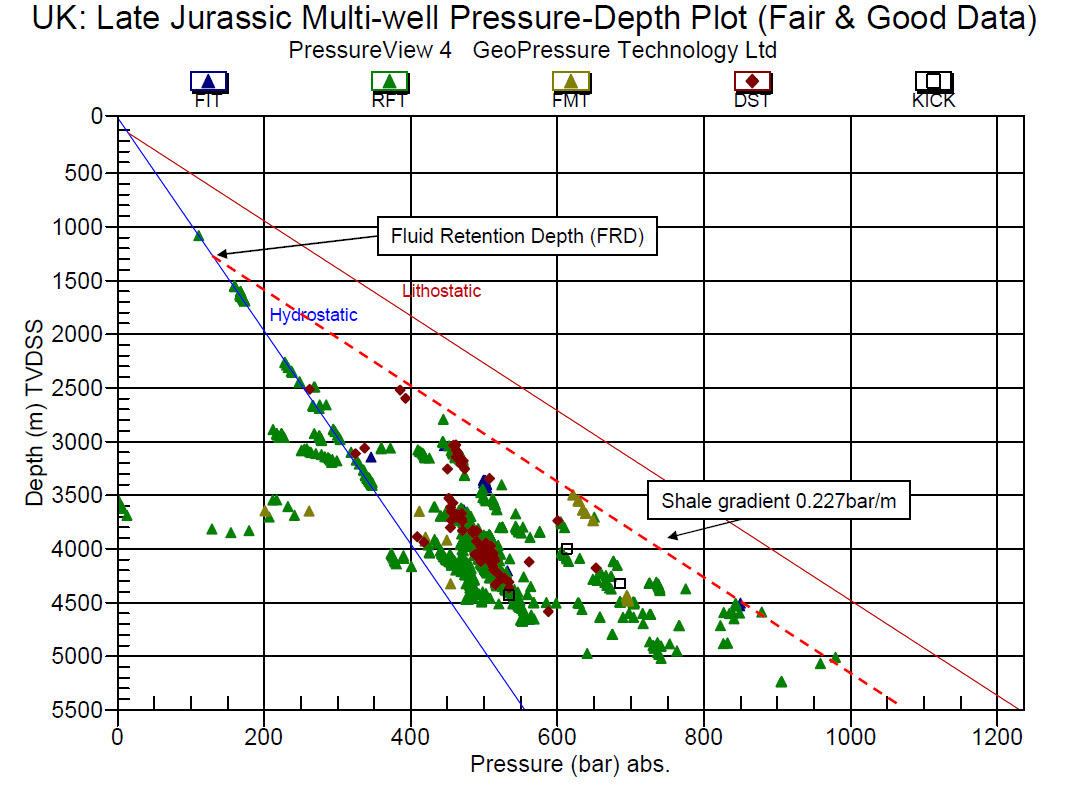
Figure 2. Recent PressureView workflow enhancements focused on strengthening the reliability and usability ofcore plotting operations, including persistent scale and axis handling, improved layout control, and expanded visualisation options that support more consistent preparation and comparison of pressure–depth figures across wells and projects.
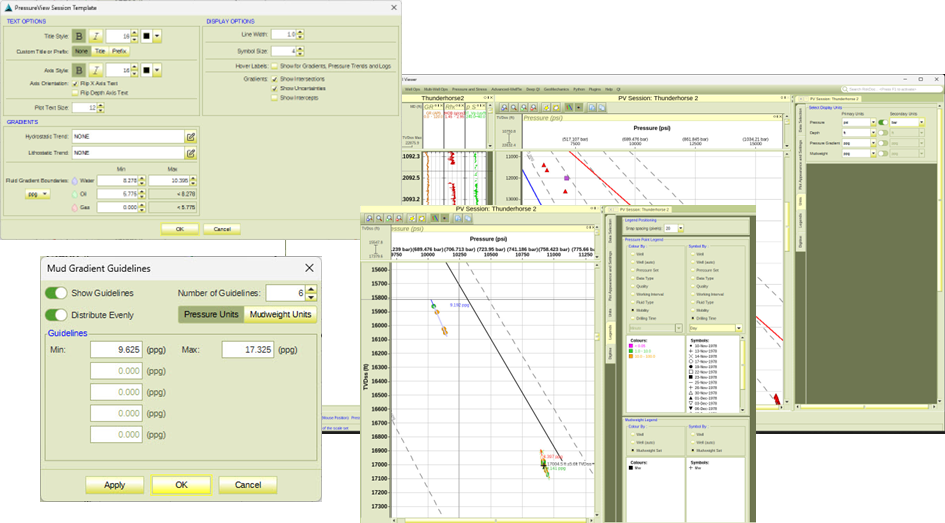
Figure 3. Example of advanced interpretation capabilities enabled by the strengthened PressureView framework,demonstrating multi-domain depth handling in which interpreters can rapidly switch between alternative depth references while preserving gradients, annotations, and interpretation context within a single persistent plotting environment.