We are excited to announce the release of our new Exploratory Data Analysis (EDA) tool for well-log data. This tool is designed to help users gain deeper insights from well-log data through interactive data visualization, statistics, and preprocessing. Well-logs often come with bad measurements/noise, gaps (often referred to as NULL), and inconsistencies, and EDA allows us to visualize trends which helps in identifying anomalies, checking data quality issues, and finally gaining key insights into the relationships between logs. This process is necessary before applying any machine learning (ML) algorithms to the data. Several models including DNN will not work if the data have NULL values. Also, ML models may pick up bad data, give inaccurate predictions, and fail to generalize new data. EDA can reveal insights about the relationships between well-log measurements and geological features, helping to choose the most suitable ML models and assess their performance accurately.
Key Features:
Data Statistics
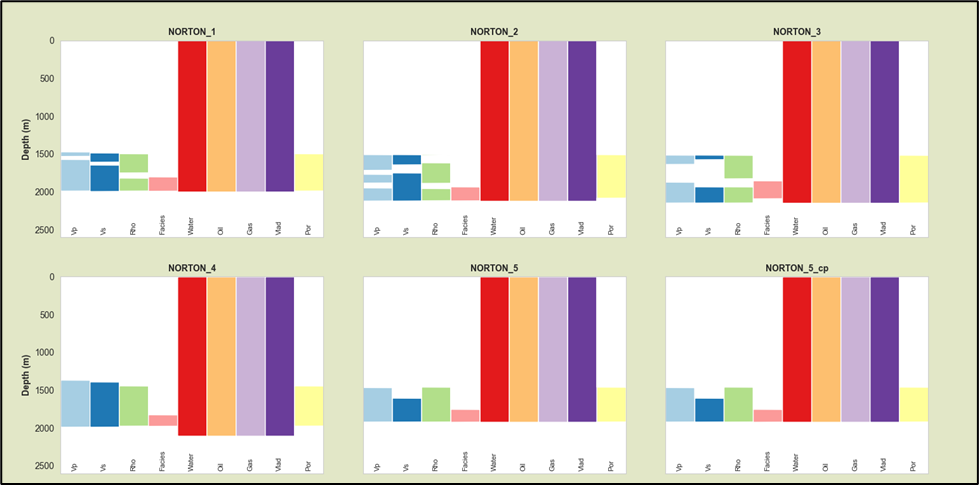
- Missing value summary tables and plots visualize gaps and quality issues in your well-log data
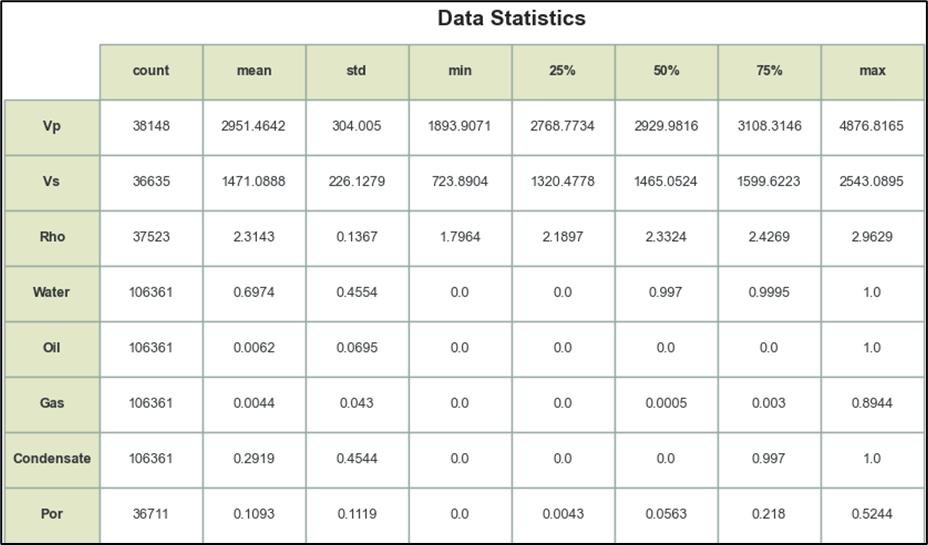
- Descriptive statistics like mean, and percentiles provide summary information on data distribution
Data Imputation (fill the gaps)
- Apply sophisticated iterative imputation to fill gaps and clean issues in well logs
- Increased sample size improves statistical power for further analysis
Interactive Visualizations
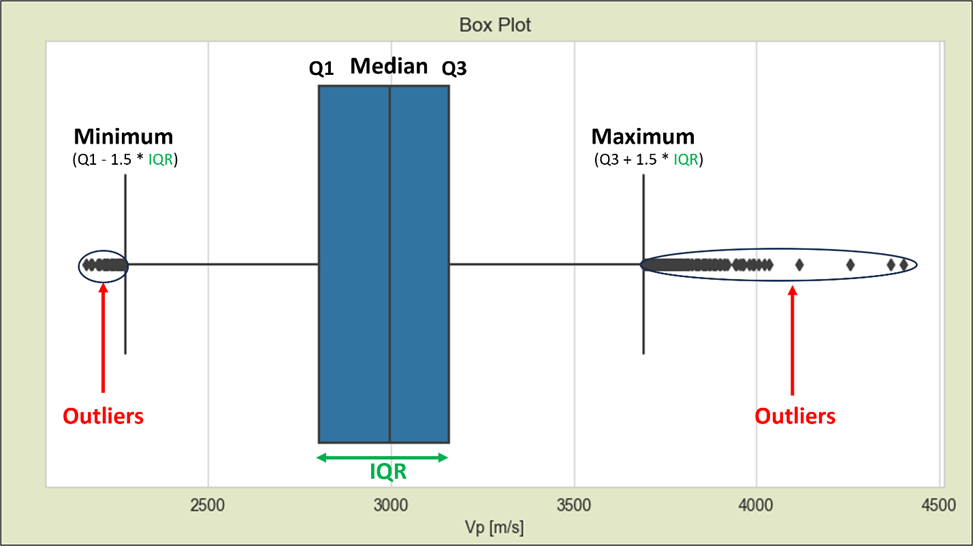
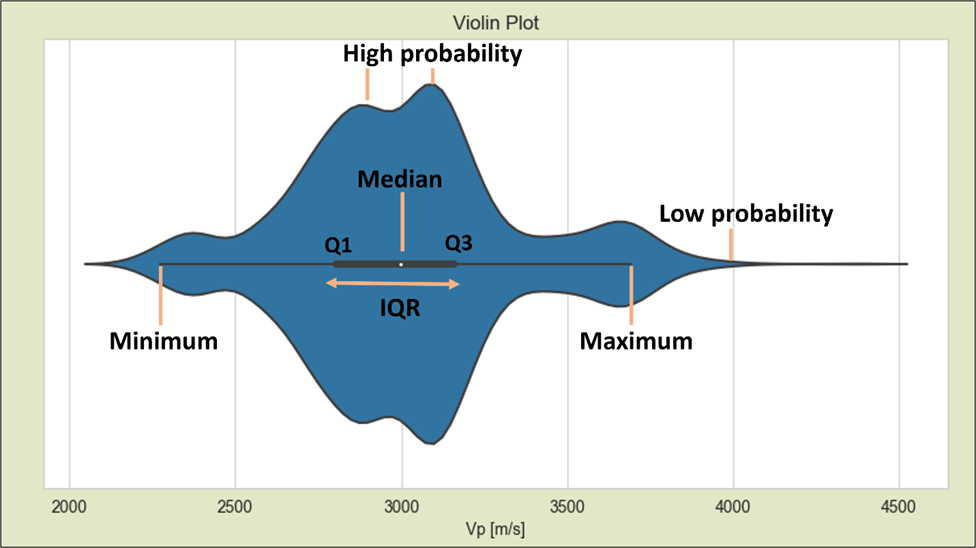
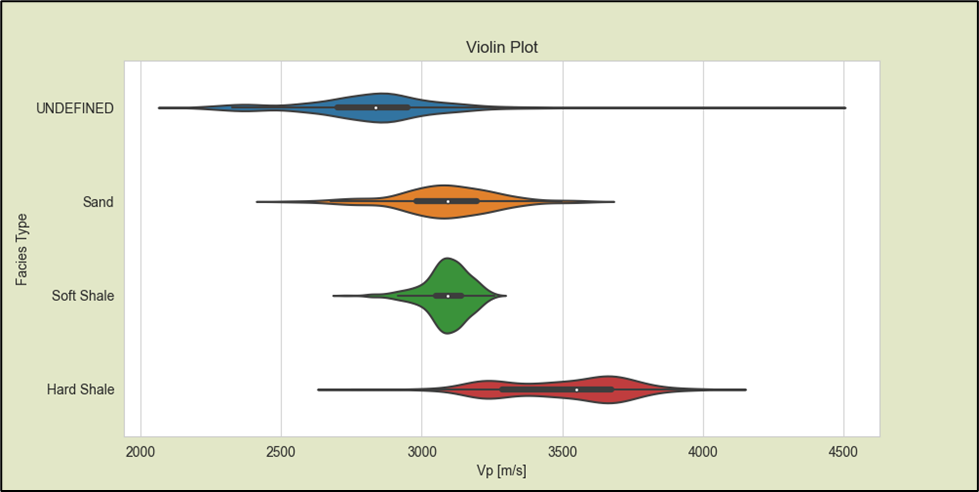
- Box plots and violin plots visualize the distribution, spread, and skewness of well-log data
- Plots can be segmented by facies, allowing visual contrast of data distributions across different subsurface formations
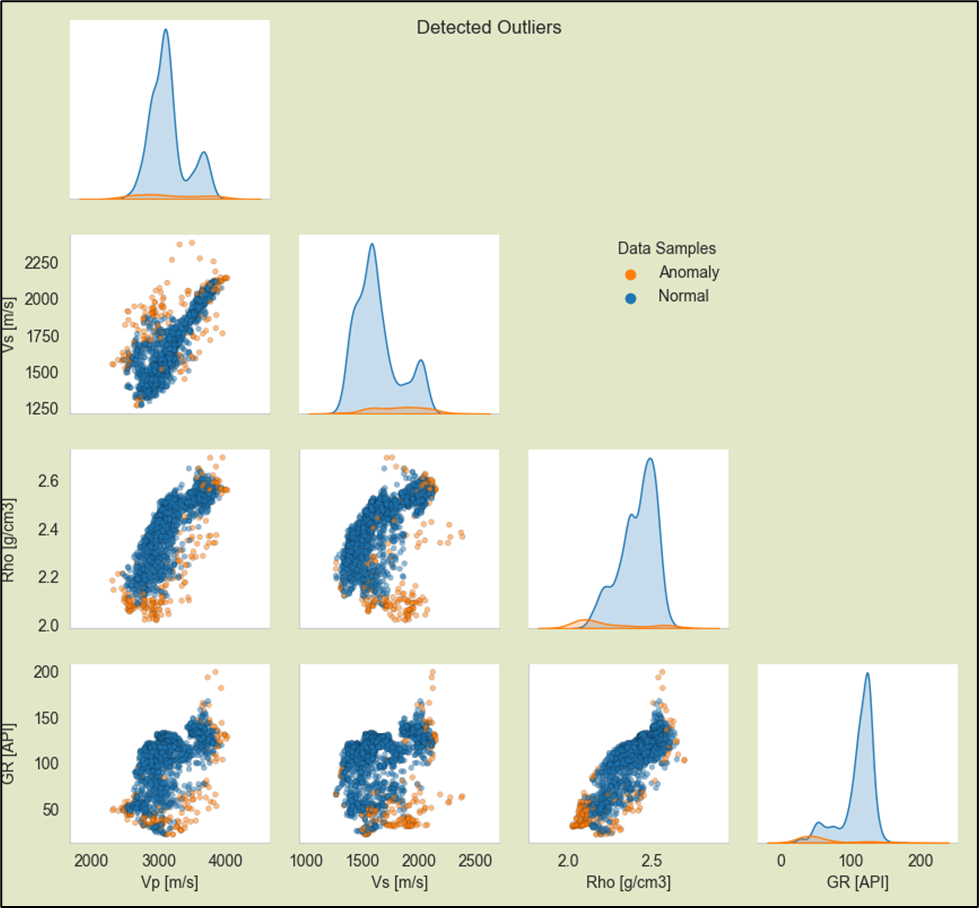
Outlier Detection
- Apply the Isolation Forest algorithm to automatically detect anomalies in multivariate well logs
- Clean outliers from datasets before feeding into machine learning models
The tool also outputs an 'Indicator Log', which indicates the data state across imputation, and outlier removal to enable traceability. The same log can also be further used for generating working intervals for a specific set of samples (for example: null data interval can be created and RPM can be applied to those samples, imputed data interval can be created and can be further QC'd in cross-plots).
This new EDA tool will make well-log analysis more efficient, interactive, and insightful. It is a very easy-to-use tool, that makes basic statistics and advanced visualization accessible to users without programming expertise.
-4.png?width=120&height=120&name=MicrosoftTeams-image%20(3)-4.png)